
Ever wanted a way to easily see how local planning authorities (LPAs) are doing on their housing targets?
Well, here you go:
And here's how London is doing:
NOTE: The heatmap above shows the housing supply data for 2018. The 2019 data should be released soon and we’ll be publishing an updated version as soon as it’s live.
Click here to get notified the second the new data comes out.
Key insights from the data
Overall, England is doing pretty well.
Of the 324 authorities we have data for, 63% of them are meeting (or exceeding) their target for housing.
In fact, between 2015 and 2018 the government has asked English LPAs to provide around 573,000 homes, and just over 644,000 have been built – that’s 112% of the target.
But that does still fall well short of the government’s pledge of 300,000 new homes a year.
In 2018, English LPAs built around 227,000 new homes – good, but still more than 73,000 homes short.
10 Local Planning Authorities Building the Most Housing
These are the 10 LPAs who have gone furthest beyond their target.
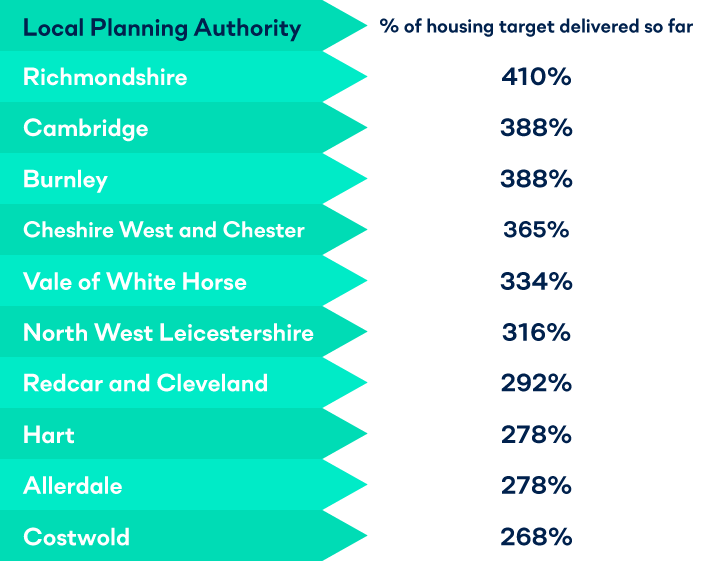
What does that mean?
Well, maybe they’ve been rubber-stamping housing applications, so it’s easy to get planning approval. Or maybe they’re so far ahead of targets, they can now afford to be picky…
10 Local Planning Authorities Building the Least Housing
On the other side, here are 10 LPAs who are very much under their targets:
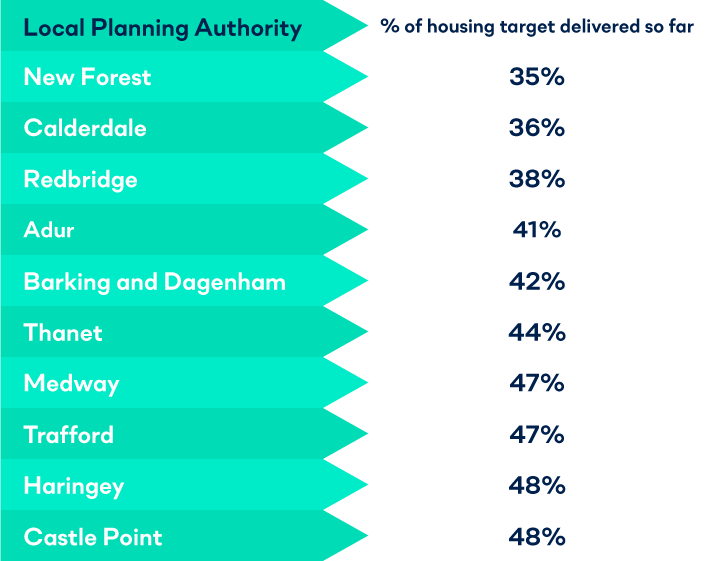
These will be areas to watch. If they continue to underperform it could become easier to get planning approval as they’re forced to widen the net for new housing.
Two caveats on the data
- It’s the government’s data
To be clear, the heatmap above is the government’s data, not ours.
Since 2018, the government has promised to release something it calls “The Housing Delivery Test” every year. In short, it’s a measure of how local authorities are doing towards their 5-year housing targets (The 5 year period between 2015 and 2020).
We’ve taken a few anomalies out (like Redditch, which was 2046% on target and really skewed the numbers, and Barrow-in-Furness and the Isles of Sicily which are exempt from housing targets because their household growth is actually negative). But otherwise, it’s all data from the government.
- It’s 2018 data
We’d planned to release this for the 2019 Housing Delivery Test, which was due to be released November 2019.
But… then October to December 2019 turned into an election period. This meant the release of any government data had to be delayed until a new Government was formed due to purdah rules.
So no 2019 data yet. But we’ll update this as soon as the new data becomes available.